Get all the support related to ticker here. Start with finding your query.
Ticker by Finology is an equity research and company analysis tool. Analyzing stocks is a serious affair, and with Ticker, you get a one-stop destination for cutting-edge stock research. You get every information about stocks in Ticker making it Investing ka search engine. To know more, please visit here.
Ticker sources its data from Accord Fintech services.
Ticker is quick! All data in relation to the corporate actions, annual reports, and shareholders' meetings are updated within just 15 minutes of the event.
The Price data available in Ticker are delayed by 15 minutes. Thus, Ticker may not be ideal for intraday trading.
We take annual data from the annual reports of companies and not from the unaudited results present in the company's quarterly reports. This may cause a delay in updating annual results, but the data is 100% correct in these cases.
As soon as the company declares its quarterly results, it is updated on Ticker by the end of that particular day.
Few ratios are updated daily based on live data such as PE ratio, PB ratio, etc. Other ratios on Ticker are calculated based on the last financial year’s available data.
Ticker has comprehensive data and research about all the listed companies. There will also be customized ratios like P/E, ROE, ROCE, PEG, CAR%, etc. For every company, we have mentioned the pros and cons in a one-liner format. Also, for more reference, we have added price and valuation charts which have data for up to 5 years. We have also explained the shareholding pattern, which shows details about the company’s promoters pledging and more. Peer comparisons are also present. In addition to all these, corporate actions, reports, news updates, and analysts updates are also present on Ticker. If you want to add stock to your watchlist, you can add up to 30 stocks and create a smart portfolio by adding up to 20 stocks. Basic bundles like emerging bluechip, value trap, etc., are present.
Following are some free add-on features on Ticker:
Invest in your favorite brand: Search any brands you are using or looking for and find out which company owns them. For example, search Dove and get to know that it’s an HUL product.
IPO Watch: Get the details about upcoming, ongoing, and newly listed IPOs, all in one place to achieve listing gains and invest in the company primarily.
Track Index: Track live market movements with all the indices and their details.
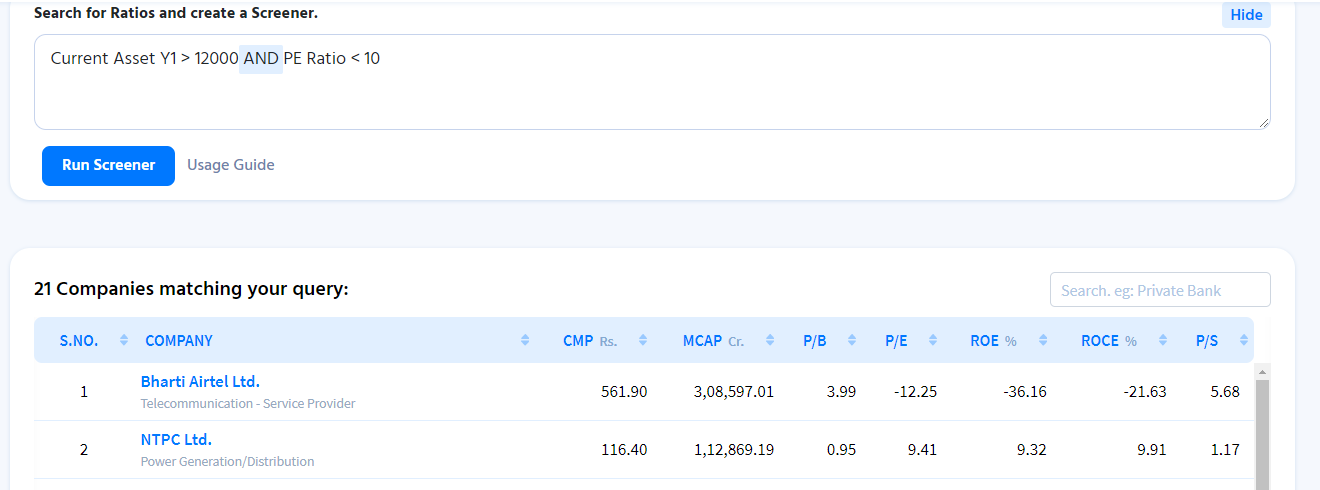
Screener: Filter out stocks from the set of 5000+ companies based on your criteria. For example, find stocks that have a profit of more than 10k crores, etc.
Super Investors: Find out which stocks your favourite, most successful investors hold, and track all their holdings. For example, Rakesh Jhunjhunwala has invested in Delta Corp.
Additional Data: New data such as volume chart, PB chart, shareholding details, group companies info, etc., have been added for a more enhanced analysis.
Curated News: Get the latest news about all that’s happening in the global and Indian markets and keep up with the market's sentiment.You wouldn’t need to get a subscription to any news app!
Ticker has the following Premium features:
Powerful valuation techniques such as Discounted Cash Flow, Earning Multiple approach and Book Value Per Share (BVPS) analysis.
5 stage ROE calculation with DuPont Analysis
Common size statements analysis
An upgraded limit in Smart Portfolio with style box and watchlist
Premium Bundles
Screener is a tool that helps you filter out stocks from the set of 5000+ companies based on your criteria. For instance, your criteria can be finding stocks with a profit of more than 100 crores, stocks with a market cap of Rs 500 crores etc. We have also provided a user guide, which will help you with your requirements.
We are aware of your requirements, which is why we bring to you our smart tool, “Screener” which will help you filter out stocks from the set of 5000+ companies, according to your criteria.
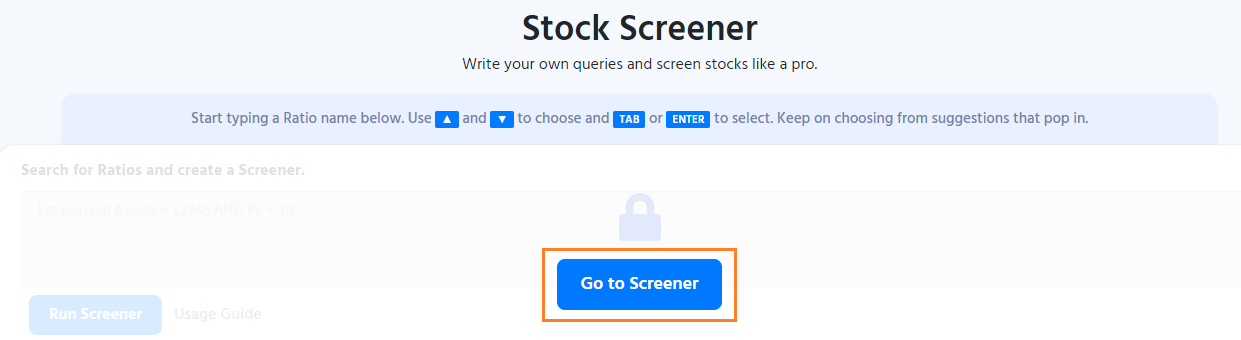
Step 1 - Please visit this link- https://ticker.finology.in/screener and click on "Go to screener".
Step 2 - Input the data based on which, you want to filter stocks.
Note: Kindly choose the inputs from the drop-down menu shown.
Step 3 - Click on “Run Screener”
And, it's done!
It is calculated through an algorithm and is automatic for each company. The algorithm used in Finstar is exclusively engineered by the research team at Finology. Finstar given on each company page on Ticker is just an aggregate picture of the company based on the historical metrics and average of that company's quantitative data. It is not a recommendation or a rating to provide the fundamental picture of the company. Also, in every rating, there is an "i" button that states which factors are calculated to arrive at the rating.
So, Ticker users can quantitatively analyze the company with Finstar and other data, and qualitatively through the various reports available. However, please remember that this is, in no way, an investment advice from us.
Oops! We are really sorry! Presently we do not have this feature on Ticker. But don't worry, we are already working on it and will launch this feature soon. Stay Tuned!
Bundles are a basket of stocks based on different strategies and themes. For example, the Cash Cow bundle shows the companies that generate huge cash in their books. It is, again, just based on the quantitative factors of the company and is not investment advice or small cases.
Step 1- Kindly login to your account.
Step 2- Search for the company in the search bar.
Step 3 - Select the ratios from the dropdown menu under “Company Essentials”.
Step 4- Finally, click on the plus “+” symbol.
You can add one ratio at a time. However, there is no limit to adding ratios, and one can add as many ratios as one desires.
Step 1- Click on the “edit” option under ‘Your Added Ratios’.
Step 2 - Click on the “cross button” for the ratio which you want to delete.
And, you're done!
A portfolio is a virtual platform provided to our patrons to track the movement of their investments. The portfolio provides all-round information about the stocks held by them and tracks overall returns.
/content-assets/b2a0393d0ed6466ab3bca02ddeab16f7.png)
Disclaimer- The above image is for sample purpose, and this is no way a recommendation from our end.
You can see the value of your holdings, gain/loss percentage, allocation of your holdings sector and market cap-wise, max gainer and max loser stock; in short, the summary of your entire portfolio on Ticker.
Apart from that, Ticker Plus has many additional features including a style box, which can give you information about your personal investing style.
In order to add stocks to your portfolio, kindly follow these steps-
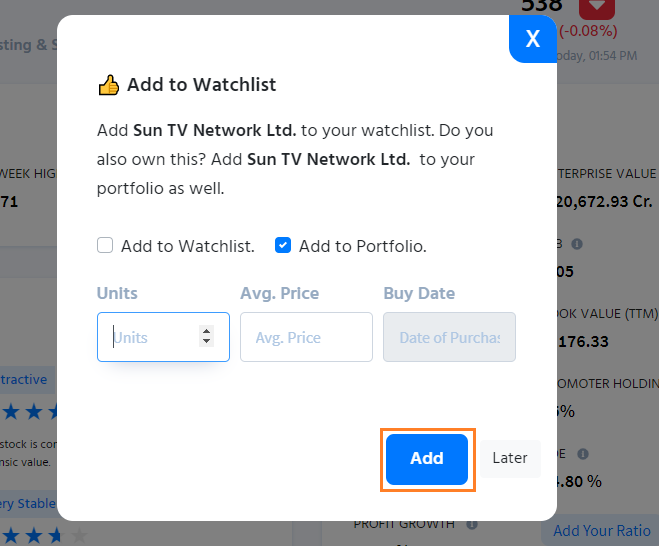
Step 1- Search for the company you want to add.
Step 2- Click on the "eye" button in the company page located at the top right corner.
Step 3- Tick the checkbox for the portfolio, mention the date and quantity of your purchase.
Step 4- Click on "Add".
You have successfully added that stock in your portfolio.
Step 1- Visit “Ticker”
Step 2- Click on the account section and click on “Portfolio”
Step 3- Click on the “Edit” symbol and then click on “Delete”
You have successfully deleted the stock from your portfolio.
One can add up to 20 stocks in their portfolio on Ticker and up to 50 stocks on Ticker Plus.
Once the subscription ends, you will not be able to access premium features like style box and portfolio insight. Also, you will not be able to track the performance of your stock holdings beyond 20 stocks.
After adding the stock in the watchlist, you will get updates about the company like bulk deal, block deal, BSE announcements, investor presentations, concall, annual reports, 52 week high/ low, and a company's credit report.
One can add up to 30 stocks in the watchlist on Ticker and up to 100 stocks on Ticker Plus.
Step 1- Search for the company which you want to add.
Step 2- Click on the "eye" button in the company page located at the top right corner.
Step 3- Tick the checkbox for watchlist.
Step 4- Click on “Add”
Voila! You’ve successfully added stocks to your watchlist.
Step 1- Visit “Ticker”
Step 2- Click on the account section and click on “Watchlist”
Step 3- Under the Action section, click on “Delete”
You have successfully deleted the stock from your Watchlist.
Watchlist will assist you to simplify and track the stocks you want to watch or buy in the future. It only includes parameters that will help you monitor the share prices.
Portfolio will keep you on track to check the average buy of your portfolio and accordingly show gain/loss statements based on the stocks' daily closing price.
If a particular company has not been trading for the last few months or years, any recent or latest data about it might not be available on Ticker. Also, when a company lists from IPO, the data present is limited because the company files its quarterly data or shareholding data in the upcoming quarter to exchanges, so it might not be available on Ticker.
Our platform is for retail investors who want to do a fundamental analysis of the company. Therefore, we have not added any charts or technicals in Ticker.
DCF calculator is helpful for companies that have been consistently generating free cash flows and investing in growing their business. Banking companies' operations consist of taking deposits and lending money. So valuing them based on free cash flow is not advisable and might show a wrong picture.
We source data from the annual/quarterly reports of the companies. The IPO companies are not yet listed in the market and thus, have not filed their reports to the exchanges. This is the reason limited data is available for IPO companies.
The difference usually occurs because one might compare the consolidated data on Ticker with the standalone data in other websites or vice versa. Kindly switch to the same mode on both websites to compare the data.
To view your added stocks, click on the "Profile" section.
If you would like to view your added stocks in the watchlist, kindly click on ‘Watchlist’ from the dropdown menu.
If you would like to view your added stocks in the Portfolio, kindly click on ‘Portfolio’ from the dropdown menu.
It helps an investor to keep an eye on the index's movement and gives a broad idea of where it is heading. For example, if the index is in Red, it indicates that the market is falling.
When you scroll down on Ticker’s home page, you’ll come across Market Movers. They assist you in finding out the market gainers, losers, 52-week high, and 52-week low of the day. You can also click on the ‘View all’ button, which will further lead you to the entire list.
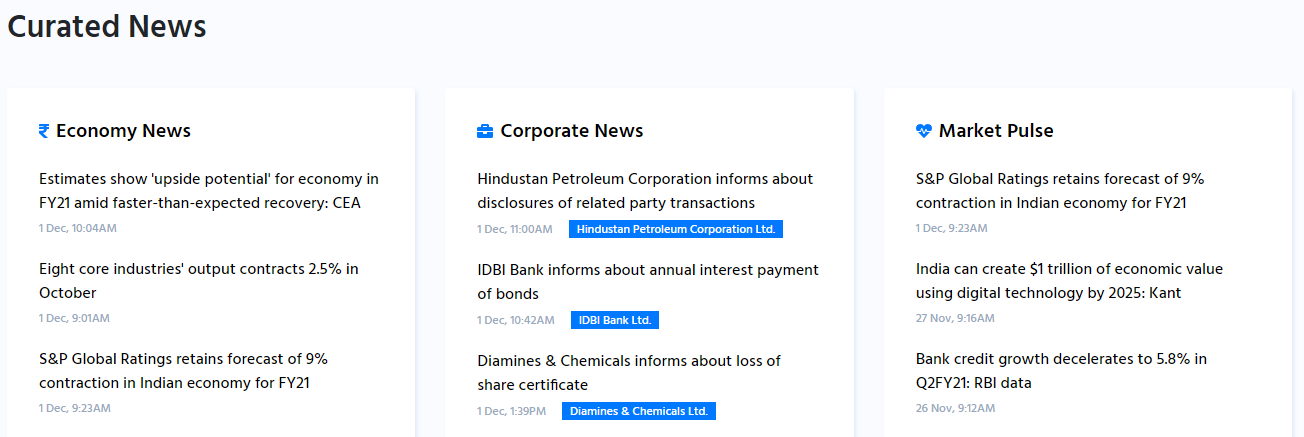
Curated News provides you with day-to-day news related to the economy, corporate sector, as well as the market. Clicking on the news headline will tell you more details about it.
1) Economy News updates the daily news related to any economic events or policies.
2) Corporate News updates the daily news related to specific companies.
3) Market Pulse provides daily news related to the market and gives regular updates on its movements.
On the company page, there is a switch on the top left corner. You can click on it to convert all data into ‘Consolidated’ mode.
/content-assets/05d9403a96cb4ea4ab1d8d7498e519e3.png)
Standalone results represent the company's performance as a single entity without considering the performance of its subsidiaries or holding companies.
Consolidated financial statements show the company's financial position along with its subsidiary companies, associate companies, and joint ventures.
Step 1- Click on the ‘Profile’ section and then click on “Watchlist” from the dropdown menu.
Step 2- On the action column, click on the menu and then choose ‘Add to Portfolio’ from the dropdown menu.
And voila! You have successfully added the stock to your portfolio!
The price-earnings ratio also referred to as the P/E ratio, P/E, or PER, represents the relationship between a company's share (stock) price and its earnings per share. This ratio is used for valuing companies and determining whether they are overvalued or undervalued.
The price-to-book ratio, or P/B ratio, is a financial ratio used to compare a company's current market value to its book value (where book value is the value of all assets minus liabilities owned by a company).
BVPS, or Book Value Per Share, is the ratio of a company’s equity available to common shareholders divided by the number of outstanding shares. It reflects the book value of the company on a per-share basis and represents the minimum value of a company’s equity if it were to be liquidated.
Discounted Cash Flow (DCF) is a method of valuation used to determine the value of an investment based on its return in the future– called future cash flows. DCF helps to calculate how much an investment is worth today based on the return in the future.
At the moment, we do not offer an auto-fill option for adding your existing portfolio. Therefore, you will need to manually add your current holdings to your portfolio. We have addressed this concern in the help section of our support portal. To find detailed steps on how to add stocks to your portfolio, you can search for "How can I add stocks to my portfolio" and follow the instructions provided.
DuPont analysis is a useful technique used to decompose the different drivers of return on equity (ROE). The decomposition of ROE allows investors to focus on the key metrics of financial performance individually to identify strengths and weaknesses
Currently, we do not offer the option to export screener data to an Excel file. However, we’re always working to improve the platform, and we’ll be sure to inform you if this feature becomes available in the future.
To access the calculators, simply click on the Docs section on the company page of our website. You'll find all the tools you need right there.
Currently, Ticker doesn't offer the functionality to save or edit screens. However, our team is actively working on adding this feature, and we plan to roll it out soon. We appreciate your patience and support as we continue to improve your experience with Ticker.
At the moment, Ticker doesn't offer the functionality to delete or edit screens. However, our team is actively working on adding this feature, and we plan to roll it out soon.
Common size statement is a form of analysis and interpretation of the financial statement. It is also known as vertical analysis. This method analyses financial statements by taking into consideration each of the line items as a percentage of the base amount for that particular accounting period.
The earnings multiple approach is a method of comparables analysis used to value companies by applying the same financial metrics to similar businesses. An analyst using this approach assumes that a particular ratio, such as the price-to-earnings (P/E) ratio, is applicable across companies operating in the same industry or sector.
We strive to provide the latest results within 24 hours of a company's declaration to the exchanges. If the quarterly reports are unavailable, it means the company has not yet released its results. We update them as soon as the information becomes available.
No worries! Contact us and we'll resolve it right away!
Contact Us

30 stocks for the long term, investing concepts, premium valuation tools and much more await you with Finology Subscription!
Copyright © 2026 All rights reserved with Finology Ventures Pvt Ltd | All logos and Trademarks registered with their respective owners.
Privacy Policy Terms of use Refunds Policy